Performance by Property Sector/Subsector
A monthly update of the performance of the property sector/subsector indexes of the FTSE Nareit U.S. Real Estate Index Series.
Monthly Summary Performance as of August 31, 2026
Monthly Index Values & Returns
Complete History of Monthly Returns by Investment Sector
Monthly Index Constituents
The following files contain monthly constituent data for the FTSE Nareit U.S. Real Estate Index Series available in PDF format:
- 2026
- 2025
- 2024
- 2023
- 2022
- 2021
- 2020
- 2019
- 2018
- 2017
- 2016
- 2015
- 2014
- 2013
- 2012
- 2011
- 2010
- 2009
- 2008
- 2007
- 2006
- 2005
- 2004
- 2003
- 2002
- 2001
- 2000
- 1999
- 1998
- 1997
- 1996
- 1995
- 1994
- 1993
- 1992
- 1991
To obtain more detailed constituent data for indexes within the FTSE Nareit U.S. Real Estate Index Series, please contact FTSE Client Services.
REIT Performance by Investment Sector
A monthly update of the performance of the investment sector indexes of the FTSE Nareit U.S. Real Estate Index Series.
Monthly Summary Performance as of August 31, 2026
Monthly Property Index Values & Returns
Monthly Return Components by Property Sector and Subsector (.xls)
Equity
Office
Industrial
Retail
Shopping Centers
Regional Malls
Free Standing
Residential
Apartments
Manufactured Homes
Single Family Homes
Diversified
Health Care
Lodging/Resorts
Self Storage
Timberland
Telecommunications
Data Centers
Gaming
Specialty
Mortgage
Commercial Financing
Home Financing
REIT Industry Financial Snapshot
Each month, Nareit®, the National Association of Real Estate Investment Trusts®, provides a statistical snapshot of the overall REIT market. More detailed information is available in REIT indexes.
REIT Industry Monthly Data for August 2026
Industry Size
$1.61T
FTSE Nareit All REITs equity market capitalization
$1.55T
FTSE Nareit All Equity REITs equity market capitalization
$1.37T
NYSE listed REITs equity market capitalization
- REITs own over $4.5 trillion of commercial real estate assets, including listed and non-listed public and private Equity and Mortgage REITs
- 180 REITs are in the FTSE Nareit All REITs Index
- 146 REITs trade on the New York Stock Exchange
Dividends
Yield Comparison
4.04%
FTSE Nareit All REITs
3.68%
FTSE Nareit All Equity REITs
1.02%
S&P 500
- Public listed REITs paid out approximately $71 billion and public non-listed REITs paid out approximately $5 billion in dividends during 2025.
- By market cap-weighted average, 79 percent of the annual dividends paid by REITs qualify as ordinary taxable income, 10 percent qualify as return of capital and 11 percent qualify as long-term capital gains in 2025.
Leverage and Coverage Ratios
(Balance sheet data as of 2026: Q2)
34.4%
Debt Ratio
4.5X
Coverage Ratio
Average Daily Dollar Trading Volume
$11.2B
August 2026
$7.7B
August 2021
$6.4B
August 2016
Data as of August 31, 2026, except where noted.
All data are derived from, and apply only to, listed U.S. REITs unless otherwise noted.
REITWatch: Nareit's Monthly Industry Data Update
REITWatch® is a monthly statistical publication intended to provide a snapshot of the REIT industry. It includes data derived from the FTSE Nareit U.S. Real Estate Index Series and the FTSE EPRA Nareit Global Real Estate Index Series in addition to tracking the performance of individual REITs.

August 2026
Data in the current edition of REITWatch® are as of July 31, 2026, where applicable.
2026
2025
2024
2023
2022
2021
2020
2019
2018
2017
2016
2015
2014
2013
2012
2011
2010
2009
2008
2007
2006
2005
2004
2003
2002
2001
2000
1999
REIT Capital Offerings
Detailed Files
The following spreadsheets provide detailed data for listed U.S. REITs including IPOs, Secondary Equity and Secondary Debt Offerings.
Historical IPOs
Historical Secondary Equity Offerings
Historical Secondary Debt Offerings
Summary Files
The following resources provide a historical perspective of capital raised for listed U.S. REIT securities including IPOs, secondary equity and secondary debt offerings.
2026
2025
2024
2023
2022
2021
2020
2019
2018
2017
2016
2015
2014
2013
2012
2011
2010
2009
2008
2007
2006
2005
2004
2003
2002
2001
2000
1999
Quarterly REIT Performance Data
Nareit's Quarterly REIT Performance Data provides a clear picture of REIT returns and operating performance in a downloadable, easy-to-read format. Stay up to date on REIT and macroeconomic fundamentals with a printable PDF containing data on REIT total returns, FFO growth, leverage, and more.
The 2026 returns have demonstrated strong equity REIT performance, with year-to-date (YTD) total returns of 14.4% for the FTSE Nareit All Equity Index as of June 22, 2026. mREITs have posted a narrow loss of 0.2%, with home financing mREITs recording a YTD gain of 0.9% and commercial mREITs a YTD loss of 3.3%. Global REIT returns remained positive, with the FTSE EPRA Nareit Developed Index returning 8.3%. REITs continue to provide attractive dividends; equity and mREITs offered YTD dividends of 3.7% and 12.8%, respectively.
Get quarterly REIT performance data and the latest REIT-related research sent to your inbox. Subscribe to Nareit Research.
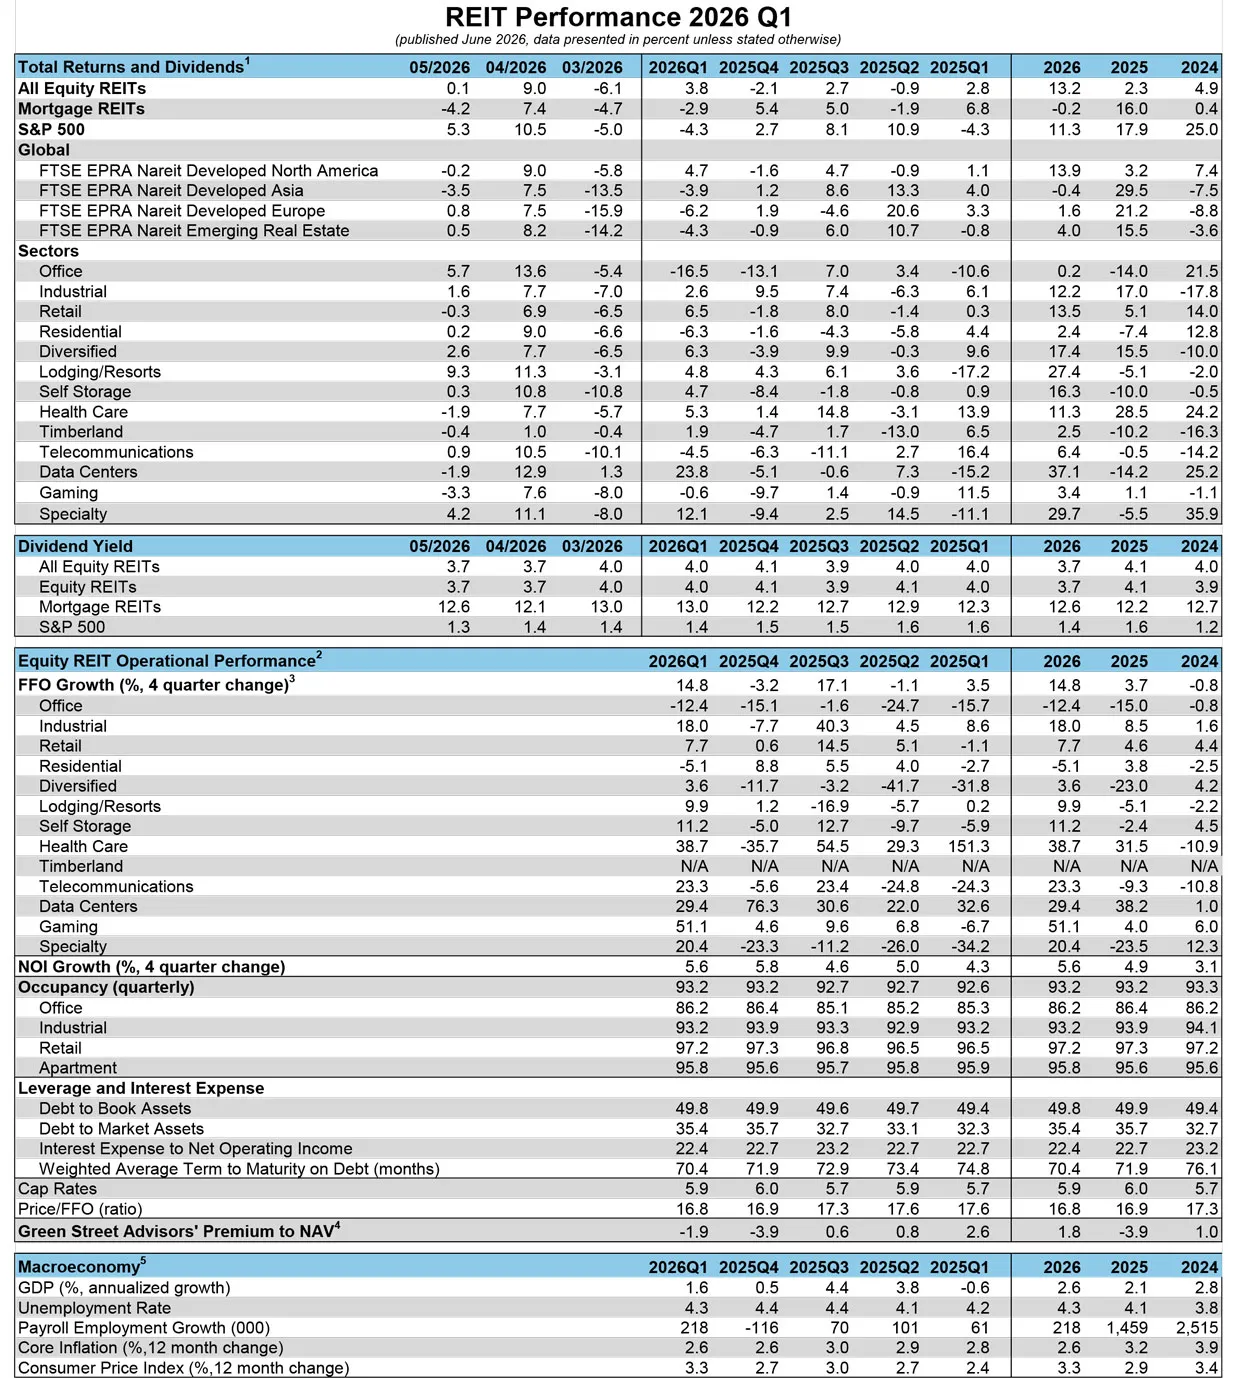
Footnotes:
1Source: FactSet, FTSE Nareit US, FTSE EPRA/Nareit Global; YTD Data as of May 29, 2026
2Source: Nareit REIT Industry Tracker, except where noted. Operational Performance is dollar weighted from the FTSE Nareit All Equity REITs Index.
3YTD % change
4Source: Green Street Advisors All REIT Premium to NAV; Data as of May 29, 2026
5Source: Bureau of Economic Analysis GDP report and Bureau of Labor Statistics Employment and CPI reports; 2026 Data as of Q1:2026
Annual Index Values & Returns
A complete history of annual returns by investment sector and property sector.